
If you’re paying attention to the housing market, you know that things can change quickly. While many areas are seeing steady growth, some homeowners are facing tougher times. In September 2025, Florida emerged as the state with the highest foreclosure rate, followed closely by Delaware and Nevada. This means that, unfortunately, more families in these areas are facing the difficult prospect of losing their homes. It’s a serious issue, and understanding why it’s happening is key to navigating these challenges.
As someone who’s been watching the real estate world for a while, I’ve seen cycles come and go. This data from ATTOM, a leading real estate data firm, gives us a snapshot of where the pressure points are right now. It’s not just about the numbers themselves, but what they tell us about the underlying economic health of these regions and the lives of the people living there.
5 States Facing the Highest Foreclosure Rates in 2025
The Foreclosure Picture in September 2025
Let’s break down what’s happening nationally first. In September 2025, there were 35,602 properties that experienced a foreclosure filing. This includes everything from initial default notices to scheduled auctions and properties that lenders took back. While this number was a tiny bit lower than in August (down 0.3%), it’s a significant 20% jump compared to September of the previous year. This year-over-year increase is what really tells the story – it shows a trend of building pressure, not a fleeting blip. On a national level, this means one in every 3,997 housing units had a foreclosure filing.
Digging deeper, we see that new foreclosure starts were down 2% from August to 23,761. However, these starts are still up a notable 20% from last year. On the other hand, completed foreclosures – known as REOs (Real Estate Owned), where lenders officially repossess the property – saw a month-over-month dip of 7%. But just like with starts, they are up significantly, 44%, from this time last year. This tells me that while some new cases might be slowing down a bit, the backlog of properties entering the system and those already in it are still creating a challenging environment.
Why Are These States Struggling?
The top five states with the most foreclosure activity in September 2025 were Florida, Delaware, Nevada, Indiana, and South Carolina. What’s interesting here is that these states are geographically diverse. This isn’t just a problem in one corner of the country; it’s a sign of broader issues affecting homeowners across different economic landscapes.
While the official data doesn’t always spell out the exact reasons for each state, I can tell you from experience that a few common factors usually contribute to higher foreclosure rates:
- Affordability Pressures: When housing costs, property taxes, or insurance premiums rise faster than incomes, people can find themselves in a bind.
- Job Market Fluctuations: Economic downturns or industry-specific challenges in certain areas can lead to job losses, making it hard for people to keep up with mortgage payments.
- Interest Rate Hikes: For homeowners with adjustable-rate mortgages or those looking to refinance, rising interest rates can significantly increase monthly payments.
- Lingering Effects of Economic Shocks: Sometimes, the impact of past economic events, like a pandemic or regional recession, can surface later as people exhaust their reserves.
- Local Market Dynamics: Specific local issues, like a major employer leaving town or a surge in foreclosures from a previous period creating a supply glut, can affect a state’s rates.
A Closer Look at the Top 5
Let’s spotlight the states that are currently facing the most significant foreclosure challenges, based on ATTOM’s September 2025 data.
1. Florida: The Sunshine State Sees Storm Clouds
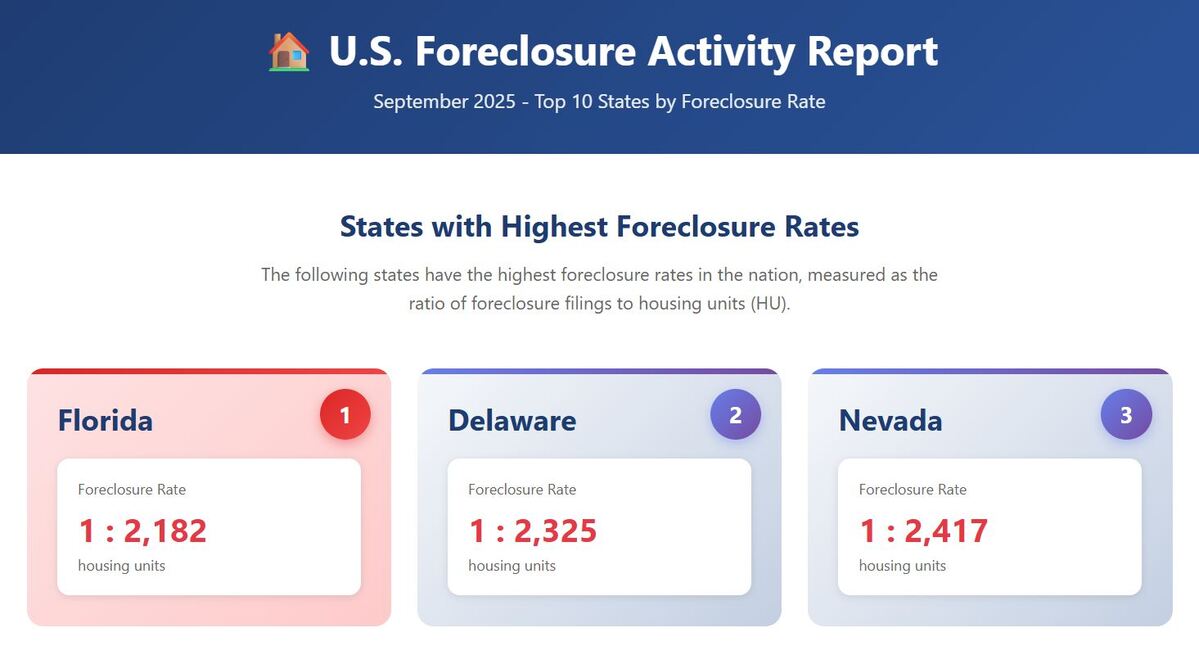
Florida takes the top spot with a foreclosure rate of 1 in every 2,182 housing units. This translates to 4,621 foreclosure filings out of over 10 million housing units. It’s a stark contrast to the typical image of a thriving tourist destination.
- Key Counties Affected: Hardee, Highlands, and Osceola counties are showing particularly high rates based on the broader report from ATTOM.
- My Take: Florida has always been a dynamic market, prone to rapid growth and sometimes, rapid corrections. I suspect a combination of rapidly appreciating home values outpacing wage growth, coupled with potential issues related to high insurance costs and perhaps some speculative buying from previous years, could be contributing factors. The sheer volume of filings here is concerning.
2. Delaware: A Small State, Big Challenges
In Delaware, the foreclosure rate is 1 in every 2,325 housing units. While the number of filings (197) is much lower than Florida, relative to its smaller housing stock, it’s a serious concern.
- Key Counties Affected: Kent, New Castle, and Sussex are the areas with the highest concentration according to the report.
- My Take: Delaware is often overlooked, but it has its own economic drivers. It’s possible that specific local industries are facing headwinds, or perhaps a significant portion of its homeowners are on fixed incomes or have adjustable-rate mortgages that are now feeling the pinch of interest rate changes.
3. Nevada: The Silver State’s Shiny Surface Tarnishes
Nevada ranks third, with a foreclosure rate of 1 in every 2,417 housing units. This means 541 filings in a state with just over 1.3 million housing units.
- Key Counties Affected: Lyon, Clark (which includes Las Vegas), and Churchill counties are seeing the most activity as per ATTOM’s findings.
- My Take: Nevada’s economy has historically been tied to tourism and development, which can be quite volatile. If there’s been a slowdown in those sectors or if a lot of people bought homes during a boom period with the expectation of continued growth, they could now be struggling to keep up with payments, especially if property taxes or home maintenance costs have surged.
4. Indiana: The Crossroads of America Faces Economic Crossroads
Indiana finds itself fourth on the list, with a rate of 1 in every 2,697 housing units. This means 1,095 foreclosure filings across its roughly 2.9 million housing units.
- Key Counties Affected: Clinton, Vigo, and Pulaski counties are experiencing higher rates.
- My Take: Indiana has a strong manufacturing base, and the automotive sector has been particularly important. If there have been significant shifts or slowdowns in these industries, it could directly impact homeowners’ ability to meet their mortgage obligations. It’s also possible that some of the housing market gains from previous years have plateaued or reversed, leaving some underwater.
5. South Carolina: The Palmetto State’s Growth Pains
Rounding out the top five is South Carolina, with a foreclosure rate of 1 in every 2,883 housing units. This involves 833 filings.
- Key Counties Affected: Lexington, Kershaw, and Allendale counties are showing elevated concern according to the data.
- My Take: South Carolina has seen substantial growth, particularly in its coastal and Upstate regions. However, rapid expansion can sometimes outpace wage growth, and a significant portion of the population might be finding it harder to keep up with rising costs of living and homeownership. Like Florida, insurance costs could also be a factor here.
🏠 U.S. Foreclosure Activity Report
September 2025 – Top 10 States by Foreclosure Rate
States with Highest Foreclosure Rates
The following states have the highest foreclosure rates in the nation, measured as the ratio of foreclosure filings to housing units (HU).
A Comprehensive Look Across All States
Here’s a detailed breakdown of the foreclosure rates by state for September 2025. This table, using data directly from ATTOM’s report, provides a clear comparison and allows us to see how all regions are performing.
| RANK | STATE | FORECLOSURE RATE (1 IN EVERY X HU) | TOTAL FORECLOSURE FILINGS | % CHANGE FROM AUG 2025 | % CHANGE FROM SEP 2024 |
|---|---|---|---|---|---|
| 1 | Florida | 2,182 | 4,621 | 15.15 | 24.42 |
| 2 | Delaware | 2,325 | 197 | 51.54 | 18.67 |
| 3 | Nevada | 2,417 | 541 | -14.40 | 14.86 |
| 4 | Indiana | 2,697 | 1,095 | 8.20 | 18.00 |
| 5 | South Carolina | 2,883 | 833 | -25.36 | 17.82 |
| 6 | Illinois | 2,883 | 1,888 | -6.30 | -13.24 |
| 7 | Utah | 3,075 | 388 | 7.18 | 15.82 |
| 8 | Ohio | 3,114 | 1,693 | -2.81 | 9.16 |
| 9 | Iowa | 3,222 | 443 | 19.41 | 65.92 |
| 10 | Texas | 3,313 | 3,589 | 3.79 | 57.83 |
| 11 | Maryland | 3,314 | 768 | 3.78 | 1.99 |
| 12 | California | 3,514 | 4,136 | 0.68 | 13.88 |
| 13 | Georgia | 3,584 | 1,251 | 32.66 | 73.75 |
| 14 | New Jersey | 3,814 | 990 | -30.43 | -4.26 |
| 15 | North Carolina | 3,937 | 1,223 | -4.75 | 62.63 |
| 16 | Pennsylvania | 4,093 | 1,412 | 42.20 | 28.13 |
| 17 | Michigan | 4,220 | 1,090 | 25.72 | 28.08 |
| 18 | Alabama | 4,234 | 547 | 22.37 | 40.26 |
| 19 | Arizona | 4,264 | 737 | 4.84 | 42.83 |
| 20 | Connecticut | 4,609 | 332 | -29.81 | -11.94 |
| 21 | Louisiana | 4,706 | 445 | -0.67 | 2.06 |
| 22 | New York | 5,020 | 1,701 | -14.86 | 5.13 |
| 23 | Colorado | 5,215 | 488 | -18.53 | 86.97 |
| 24 | Alaska | 5,406 | 59 | -10.61 | 25.53 |
| 25 | Wyoming | 5,503 | 50 | 6.38 | 138.10 |
| 26 | Virginia | 5,895 | 620 | -4.62 | 16.76 |
| 27 | Maine | 6,221 | 120 | -50.41 | 31.87 |
| 28 | Washington | 6,274 | 520 | 21.78 | 67.74 |
| 29 | New Mexico | 6,640 | 143 | -29.21 | 5.15 |
| 30 | Oklahoma | 6,653 | 265 | -10.47 | -27.00 |
| 31 | Massachusetts | 6,655 | 453 | -20.53 | -8.11 |
| 32 | Arkansas | 6,983 | 198 | 15.12 | 5.32 |
| 33 | New Hampshire | 7,239 | 89 | 25.35 | 61.82 |
| 34 | Hawaii | 7,242 | 78 | -17.02 | 4.00 |
| 35 | Missouri | 7,433 | 378 | -10.00 | 90.91 |
| 36 | Idaho | 7,615 | 102 | -21.54 | -10.53 |
| 37 | Kentucky | 7,616 | 264 | -8.33 | -12.00 |
| 38 | Tennessee | 7,817 | 396 | 3.94 | 4.49 |
| 39 | North Dakota | 7,976 | 47 | 14.63 | 62.07 |
| 40 | Wisconsin | 8,162 | 337 | 10.49 | 11.59 |
| 41 | Nebraska | 8,307 | 103 | 0.00 | 53.73 |
| 42 | Oregon | 8,714 | 211 | -12.45 | 44.52 |
| 43 | Minnesota | 9,031 | 279 | -39.08 | -10.58 |
| 44 | Rhode Island | 9,890 | 49 | -19.67 | -9.26 |
| 45 | Montana | 11,126 | 47 | 46.88 | 113.64 |
| 46 | Mississippi | 11,200 | 119 | 0.00 | -13.77 |
| 47 | Kansas | 12,011 | 107 | -23.02 | -4.46 |
| 48 | West Virginia | 17,193 | 50 | -36.71 | 72.41 |
| 49 | Vermont | 42,134 | 8 | -50.00 | -46.67 |
| 50 | South Dakota | 49,863 | 8 | -33.33 | 60.00 |
| U.S. TOTAL | 3,997 | 35,602 | -0.27 | 20.00 |
Looking Ahead: What Does This Mean for You?
The rise in year-over-year foreclosure filings is a signal that we can’t ignore. For those living in these affected states, or for anyone concerned about the housing market, it’s a good time to be proactive.
- For Homeowners: If you’re struggling to make your mortgage payments, don’t wait. Reach out to your lender immediately to discuss options like loan modifications or payment plans. Explore local housing counseling agencies for free advice.
- For Potential Buyers: This data can highlight areas where there might be more distressed property opportunities, though it’s crucial to do thorough due diligence. It also emphasizes the importance of a stable financial footing and understanding your long-term affordability.
- For Investors: Distressed properties can present opportunities, but they also come with risks. Careful analysis and understanding of the local market are paramount.
The housing market is a complex ecosystem, and this latest report from ATTOM provides a valuable, albeit concerning, look at the challenges homeowners are facing in certain parts of the country in 2025. By understanding these trends, we can better prepare and make informed decisions.
