 Secure Complaint RMAI Certified Broker
 Defense and Compliance Attorneys
Source: site
The long-defaulted federal student loans come out of the shadows of government forbearance.
By Wolf Richter for WOLF STREET.
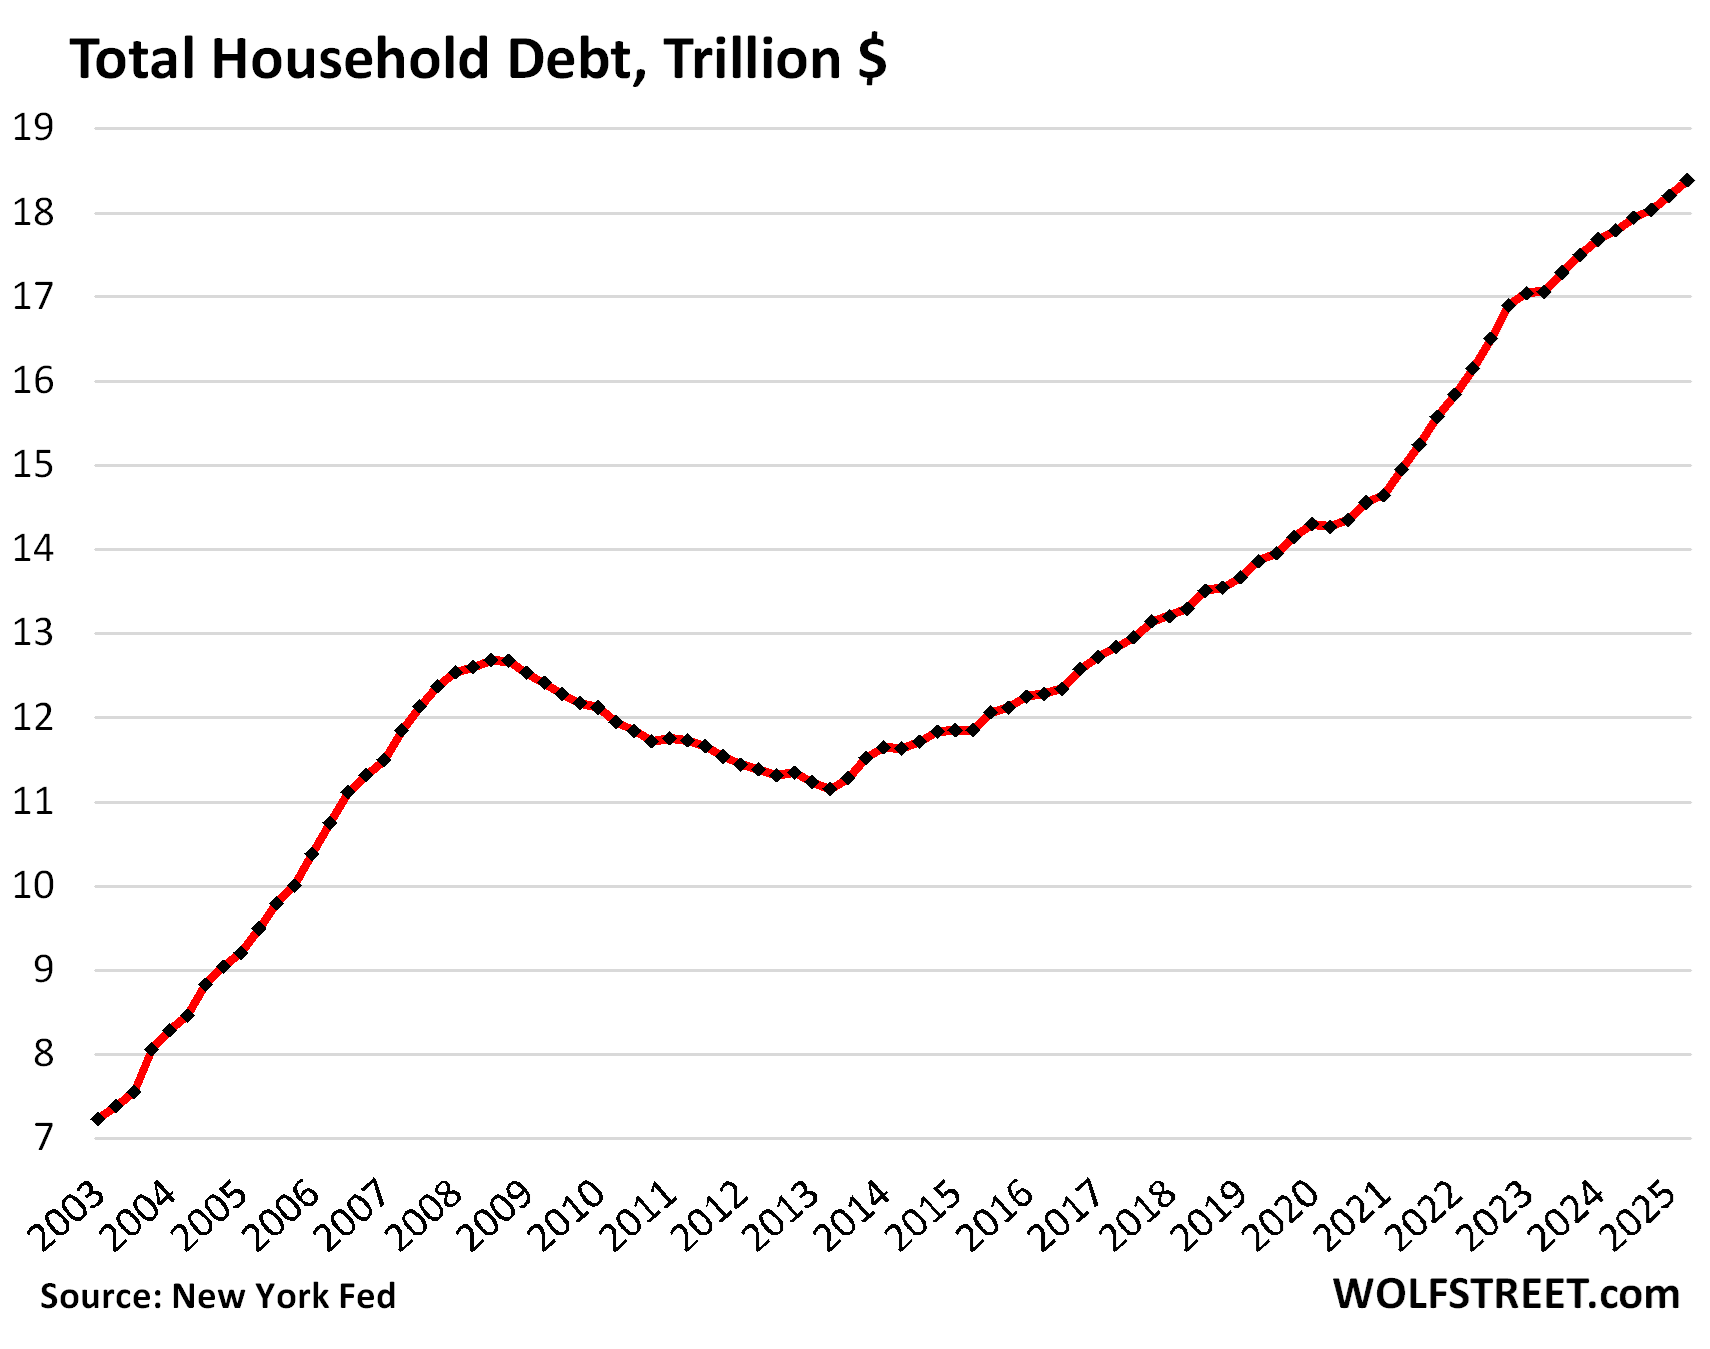
Total household debt outstanding rose by $185 billion in Q2 from Q1, or by 1.0%, to $18.4 trillion, according to the Household Debt and Credit Report from the New York Fed today.
Year-over-year, total household debt grew by $592 billion, or by 3.3%, the third-smallest growth rate since Q1 2021, behind only Q1 2025 (+2.9%) and Q4 2024 (+3.0%).
And this debt was carried by more workers earning records amount of money, and the overall burden of their debts in terms of their disposable income (the debt-to-income ratio) declined even further; more in a moment.
Balances increased quarter over quarter in the categories of auto loans, credit cards, student loans, mortgages, and HELOCs, but dipped for the second consecutive quarter in “other” revolving credit (personal loans, BNPL loans, etc.). We’ll get into the details of housing debt, auto loans, and credit cards each in a separate article over the next few days. Today, we’ll look at the overall debt, its burden, delinquencies, collections, foreclosures, and bankruptcies.
In terms of delinquencies, the standout is that student loans became loans again this year, and those loans that have been delinquent since 2020, but covered by the government’s forbearance programs, started counting as delinquent again this year, and the results are sort of funny. The move this year is so massive that it jacked up overall delinquency rates.
The burden of household debt: Debt-to-income ratio.
A common way of evaluating the burden of a debt is to look at the debt-to-income ratio. With household debt, we look at the ratio to disposable income, which accounts for more workers and higher incomes.
Disposable income, released by the Bureau of Economic Analysis, is household income from all sources except capital gains, minus payroll taxes: So income from after-tax wages, plus income from interest, dividends, rentals, farm income, small business income, transfer payments from the government, etc. Disposable income is essentially what consumers have available to spend and service their debts.
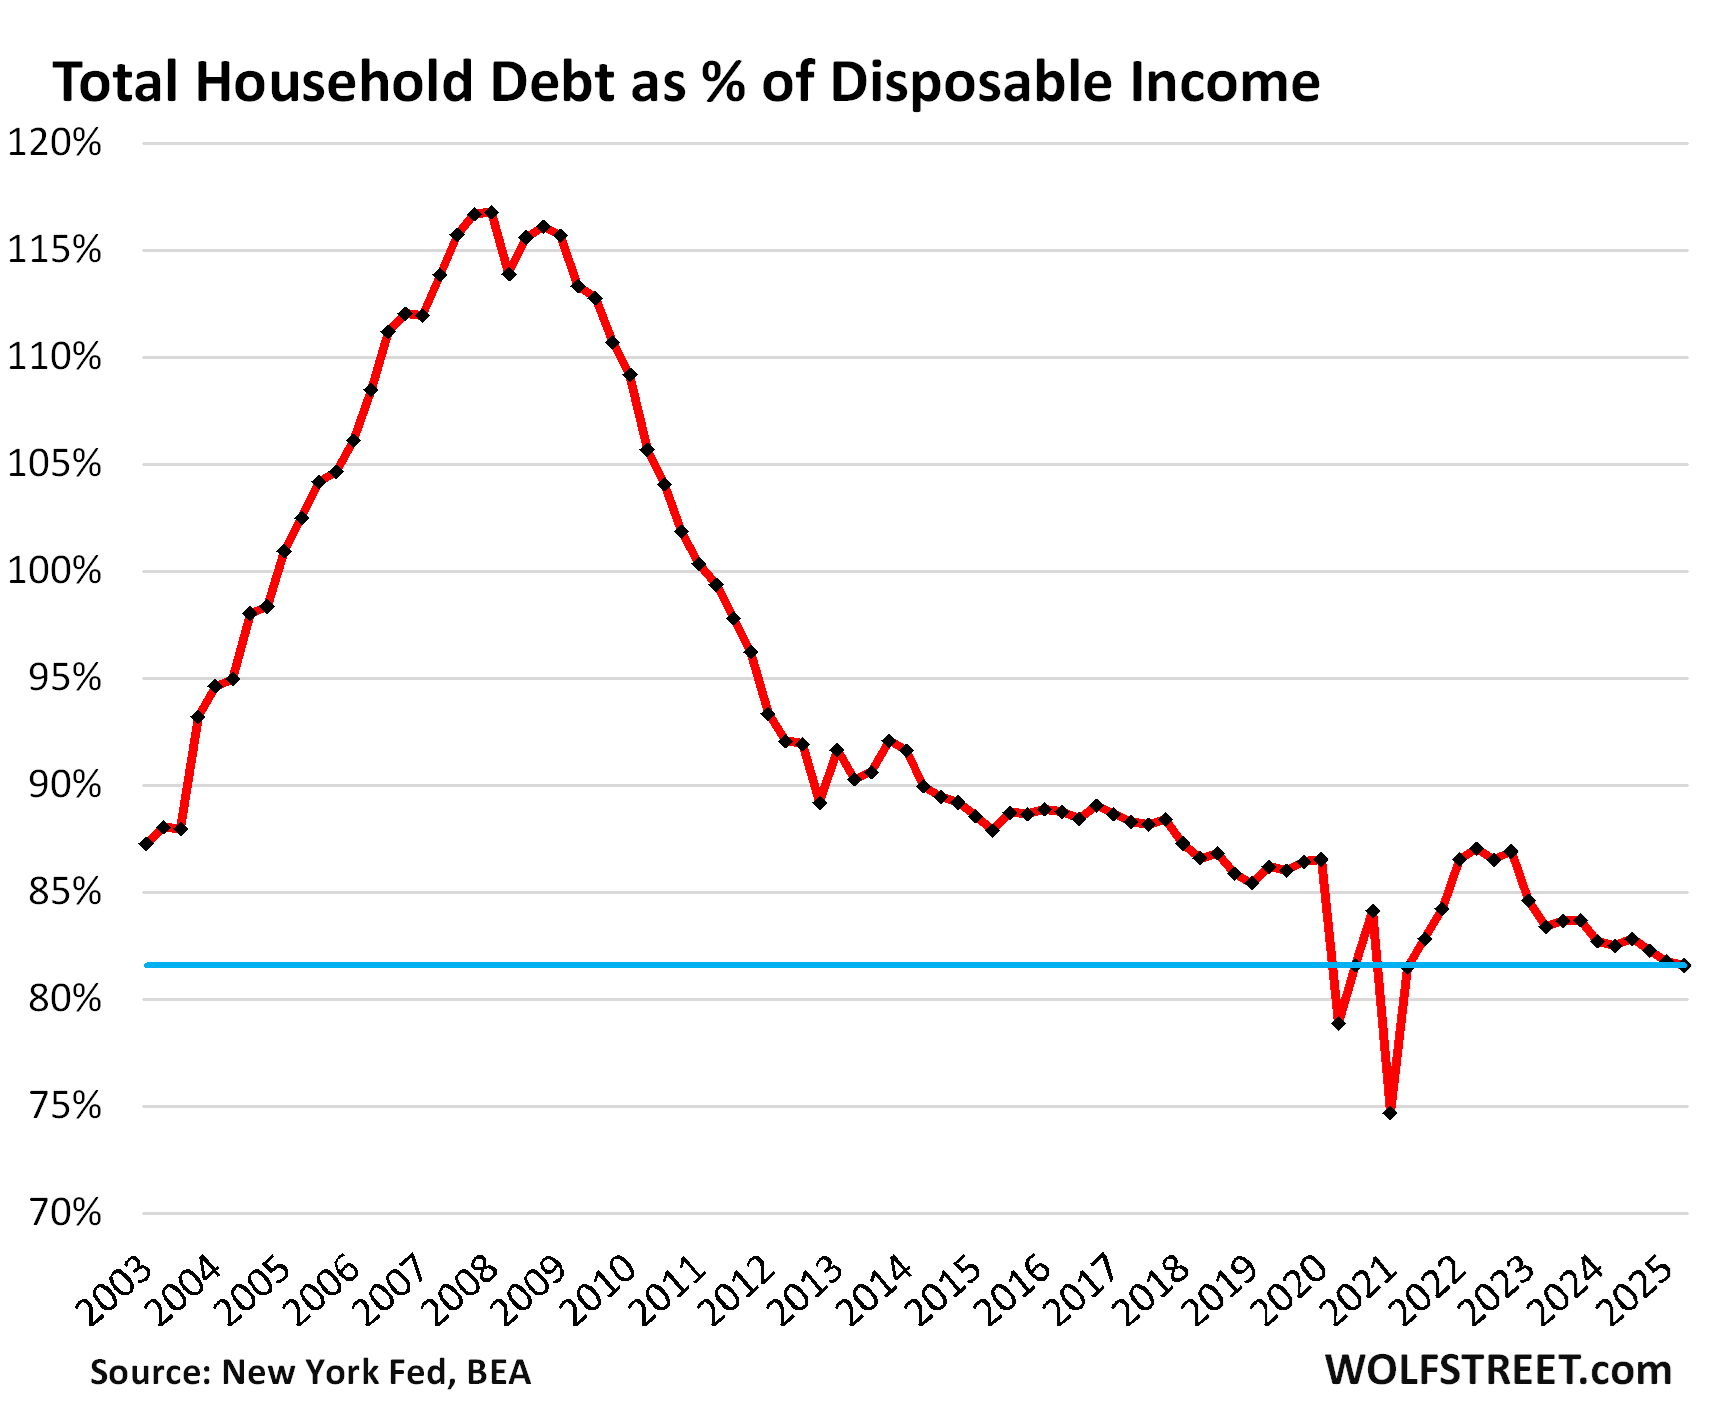
Disposable income rose faster than debt in Q2:
- QoQ: disposable income +1.2%, total debts +1.0%.
- YoY: disposable income +4.5%, total debts +3.3%.
The debt-to-income ratio thereby declined to 81.6% in Q2, the lowest ratio in the data going back to 2003, except for two quarters during the free-money-stimulus era (Q1 2021 and Q2 2020) that had inflated disposable income into absurdity.
So seen as a monolithic entity, the American Consumer is in good shape, the balance sheet is in good shape, 65% own their own homes, over 60% hold equities, they have $4.6 trillion in money market funds that still pay around 4% in interest, they have $1.1 trillion in small CDs, and $2.4 trillion in CDs of over $100,000 that all generate income. That’s a pile of cash they’re sitting on.
It seems our Drunken Sailors, as we lovingly and facetiously call consumers, learned a lesson and became a sober bunch, most of them. But not all of them.
Subprime-rated borrowers – a small subset of consumers – are always in trouble with high debt-to-income ratios and missed payments in their credit history, which is why this segment is called “subprime.” But it’s not a fixed part of the population; people fall into subprime credit scores and climb out of them all the time, it’s a constant flow. And subprime doesn’t mean “poor” or “low income,” it means bad credit; the young dentist that goes in over his head is a classic example. Low-income people rarely can borrow enough, if at all; it’s the higher income people that can borrow a lot that can get into deep trouble.
The heavily indebted economic entity to worry about is not the consumer but the federal government with its ballooning mountain of debt and reckless deficits. The other entities to worry about are overleveraged businesses, often funded by private equity and/or private credit.
Delinquent student loans face reality again.
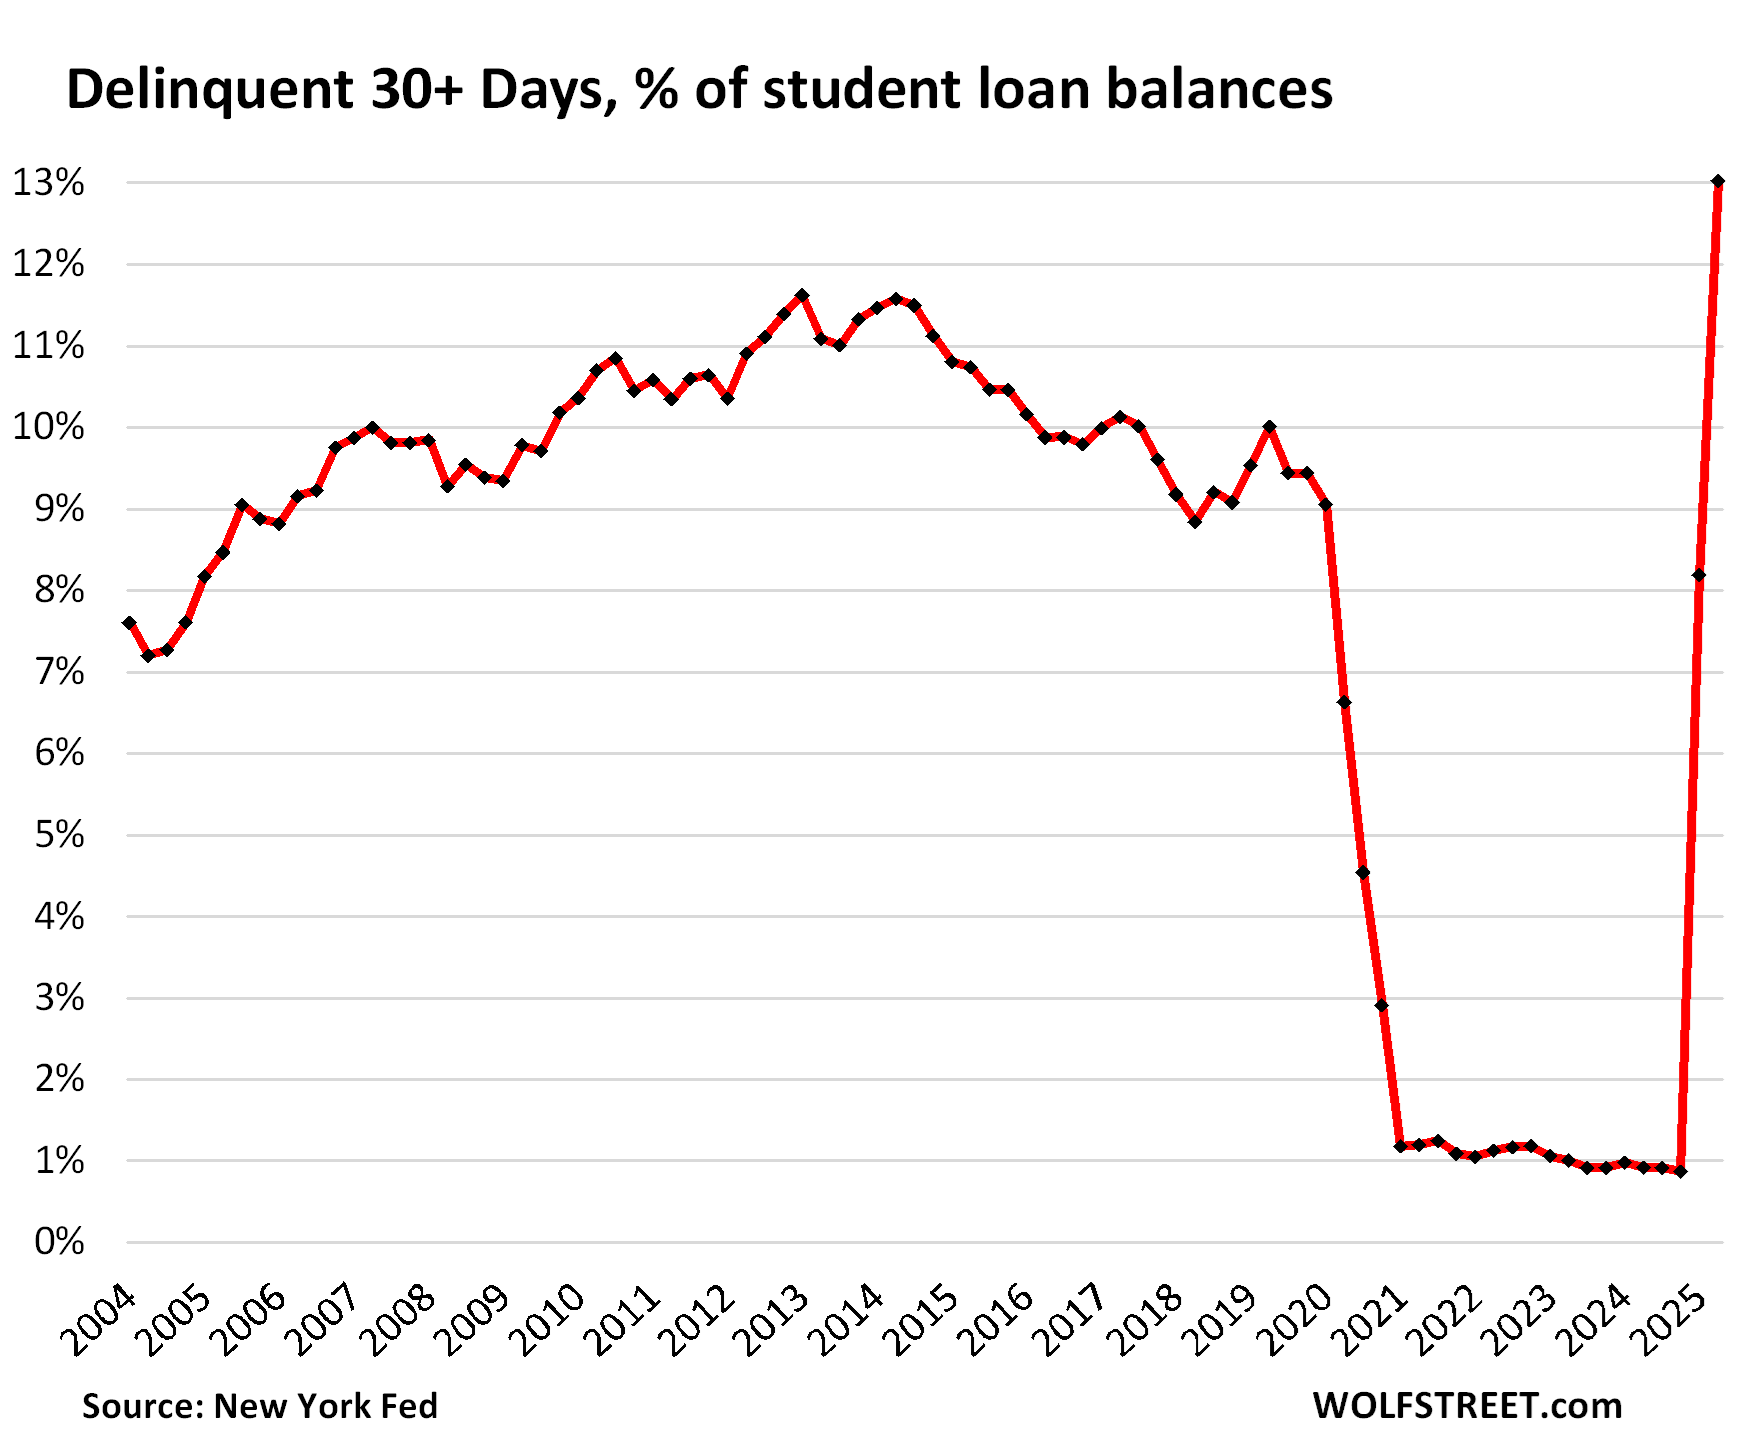
In 2025, federal student loans that had been covered by blanket forbearance since 2020 while waiting for forgiveness, face the reality again that a loan is a debt that needs to be serviced, and if it isn’t serviced as agreed, it becomes delinquent. And these delinquent federal student loans, after having been absent from credit reports since 2020, are back in them, and with a vengeance.
The 30-day delinquency rate spiked to 13.0% in Q2, the worst ever, up from 8.2% in Q1 and from 0.9% in Q4, according to the NY Fed’s report today, based on Equifax data.
Roughly $213 billion (13.0%) of the $1.64 trillion in student loans outstanding were 30-plus days delinquent in Q2.
The spike was driven entirely by moving these delinquent loans out of the shadows back into reality and into credit reports.
The 90-plus day delinquency rate for student loans spiked to 10.2%
There is suddenly an old reality out there: Delinquent loans mess up credit scores, limit the ability to borrow, and increase the interest rate borrowers have to pay when they do borrow. That should have been taught in college.
Student loans whack the overall delinquency rate. That $213 billion in delinquent student loans in Q2 caused the overall delinquency rate of 30-plus days in Q2 to shoot to 5.3%.
In Q4 2024, before these delinquent student loans were counted, the overall delinquency rate was 4.1%, well below any period before the pandemic.
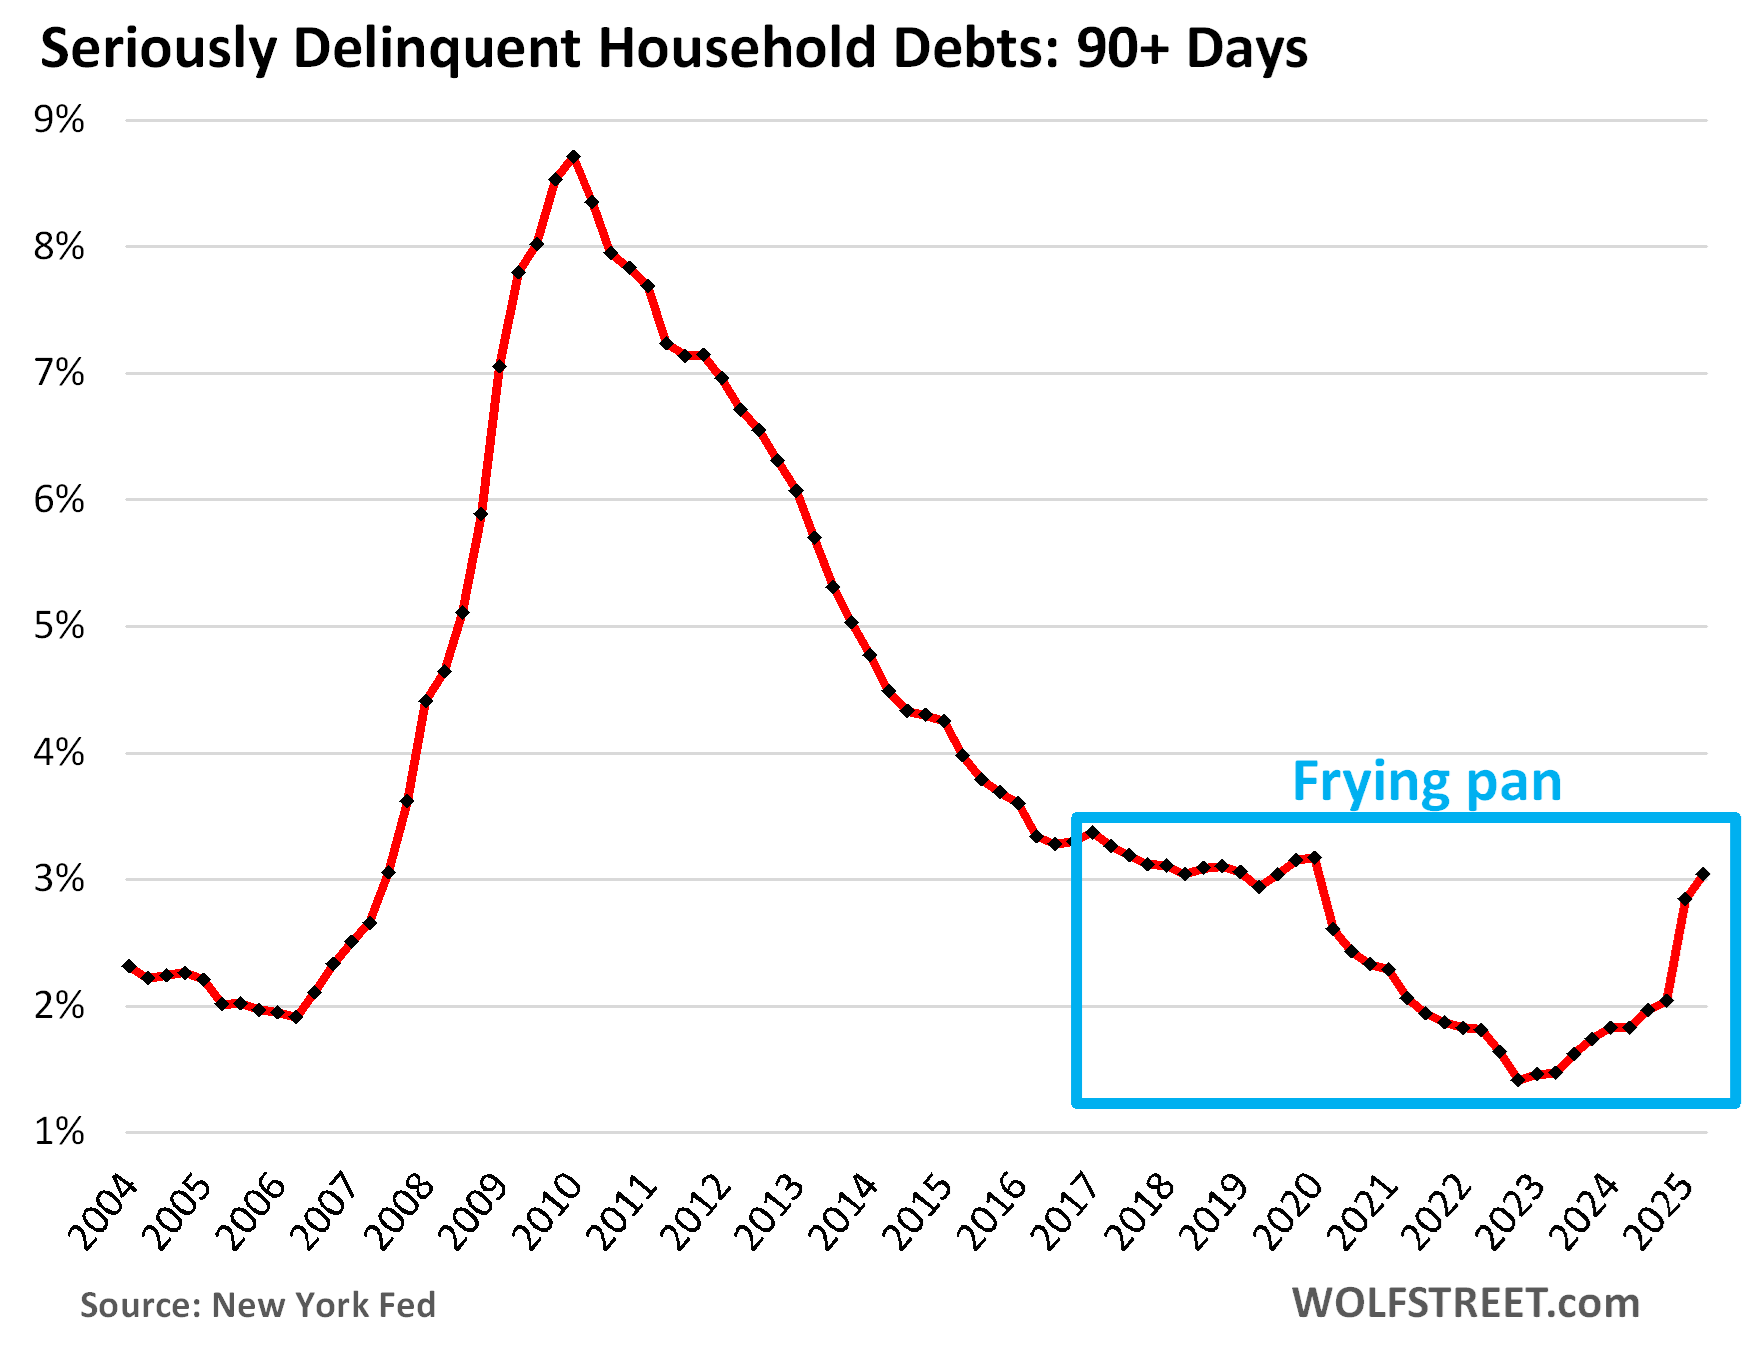
The 90-plus day delinquency rate – the rate of “serious” delinquencies – rose to 3.0%, pushed up by the 90-day student loan delinquency rate of 10.2%.
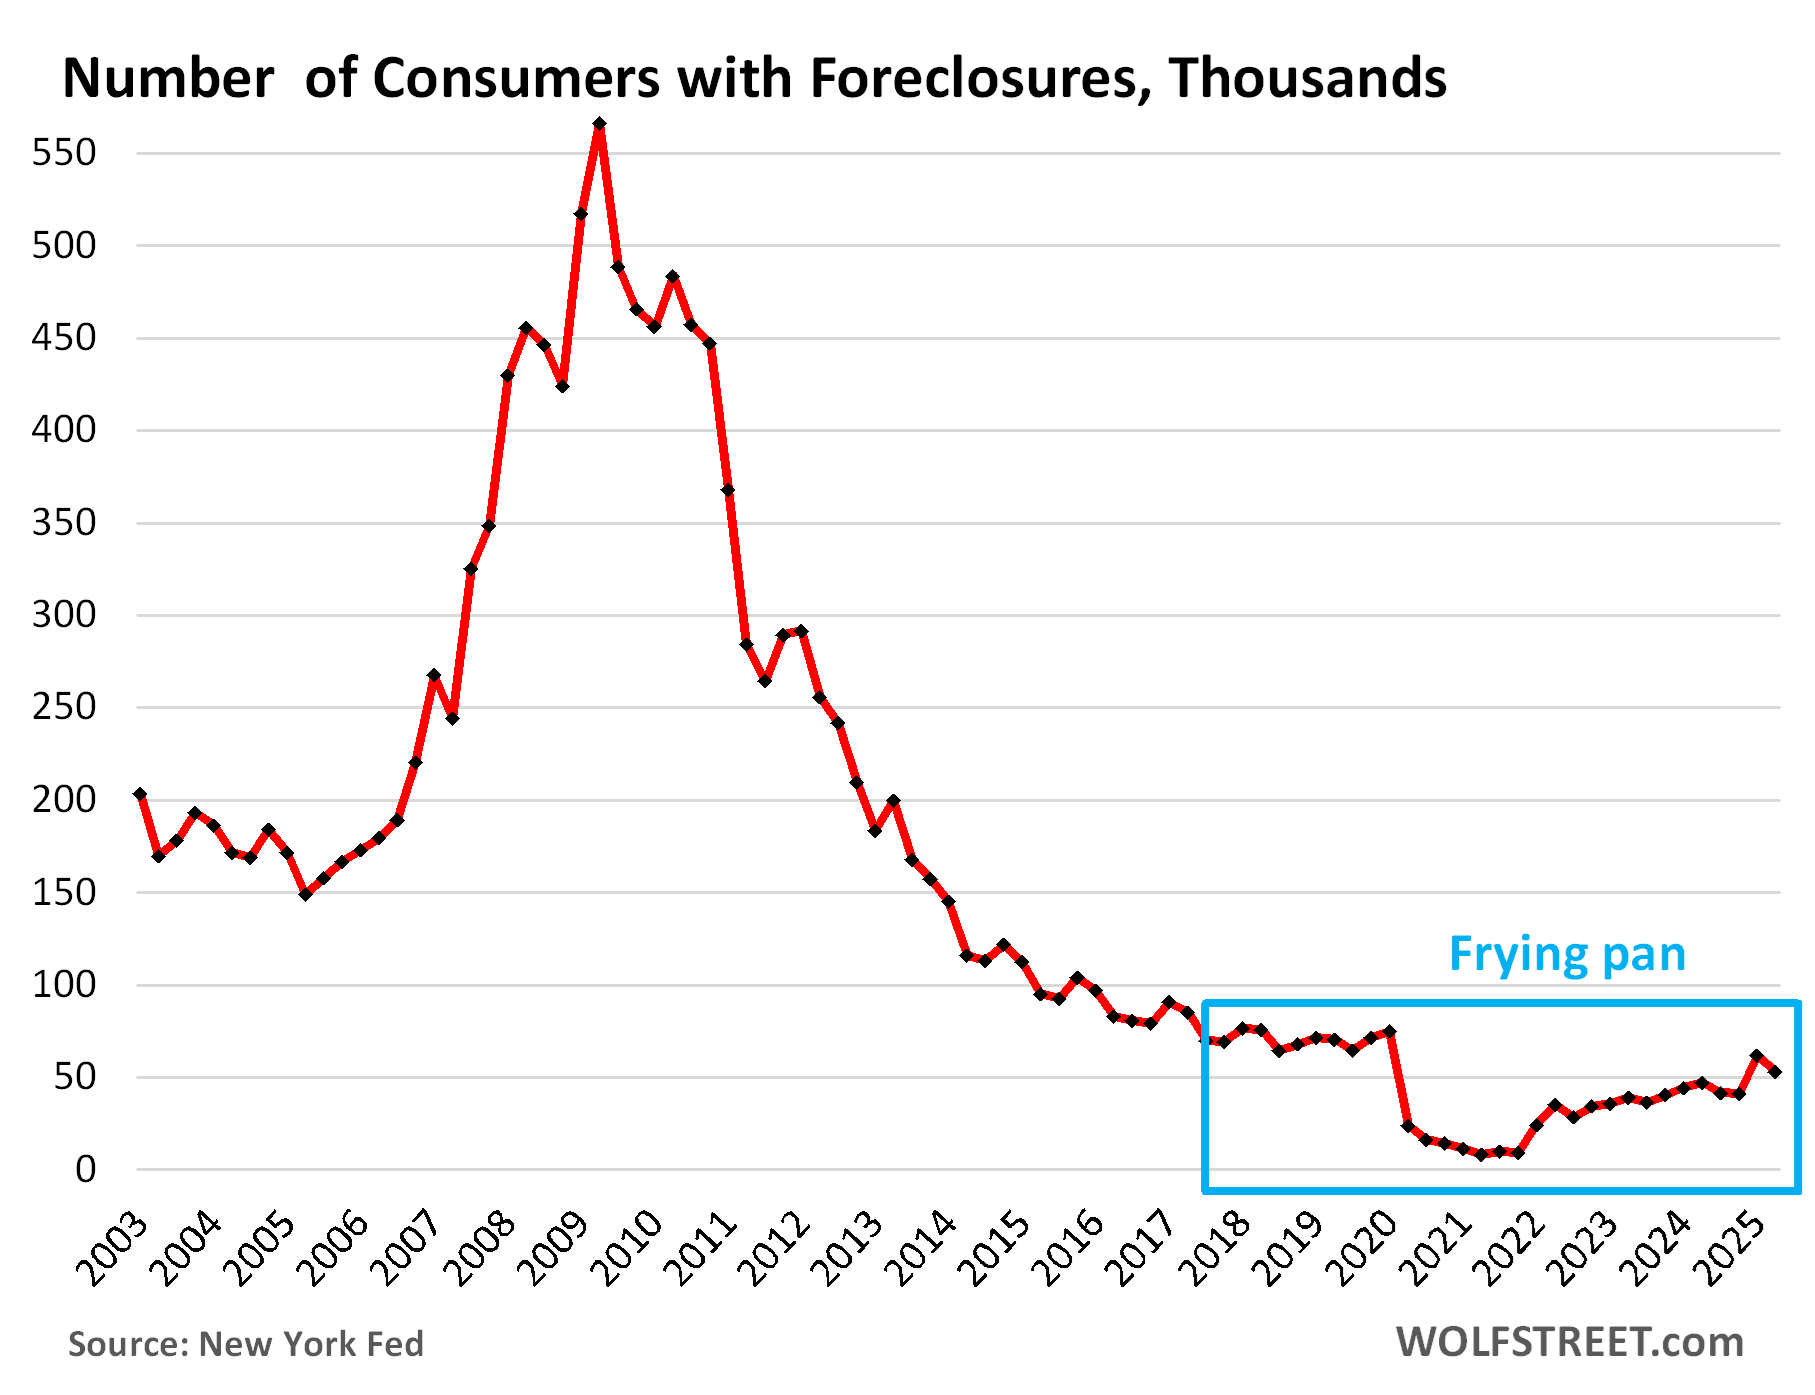
The infamous “frying pan pattern” – a WOLF STREET technical term – has formed, where the panhandle represents the prepandemic level, the pan represents the free-money level, and the other edge of the pan represents the post-free-money return to prepandemic levels:
Foreclosures declined and are low. The number of consumers with foreclosures in Q2 dipped to 52,800, and remained below the range of the Good Times in 2018-2019 between 65,000 and 90,000.
During the Free-Money and mortgage-forbearance era, during which foreclosures were essentially impossible, the number of foreclosures fell to near zero.
What is keeping foreclosures low is that home prices exploded during the Free-Money era, so most struggling homeowners can sell their home for more than they owe on it, pay off the mortgage with the proceeds from the sale, and walk away with some cash, and their credit intact.
But in markets where home prices have dropped more significantly, this option is starting to slip away from buyers who’d bought near the peak.
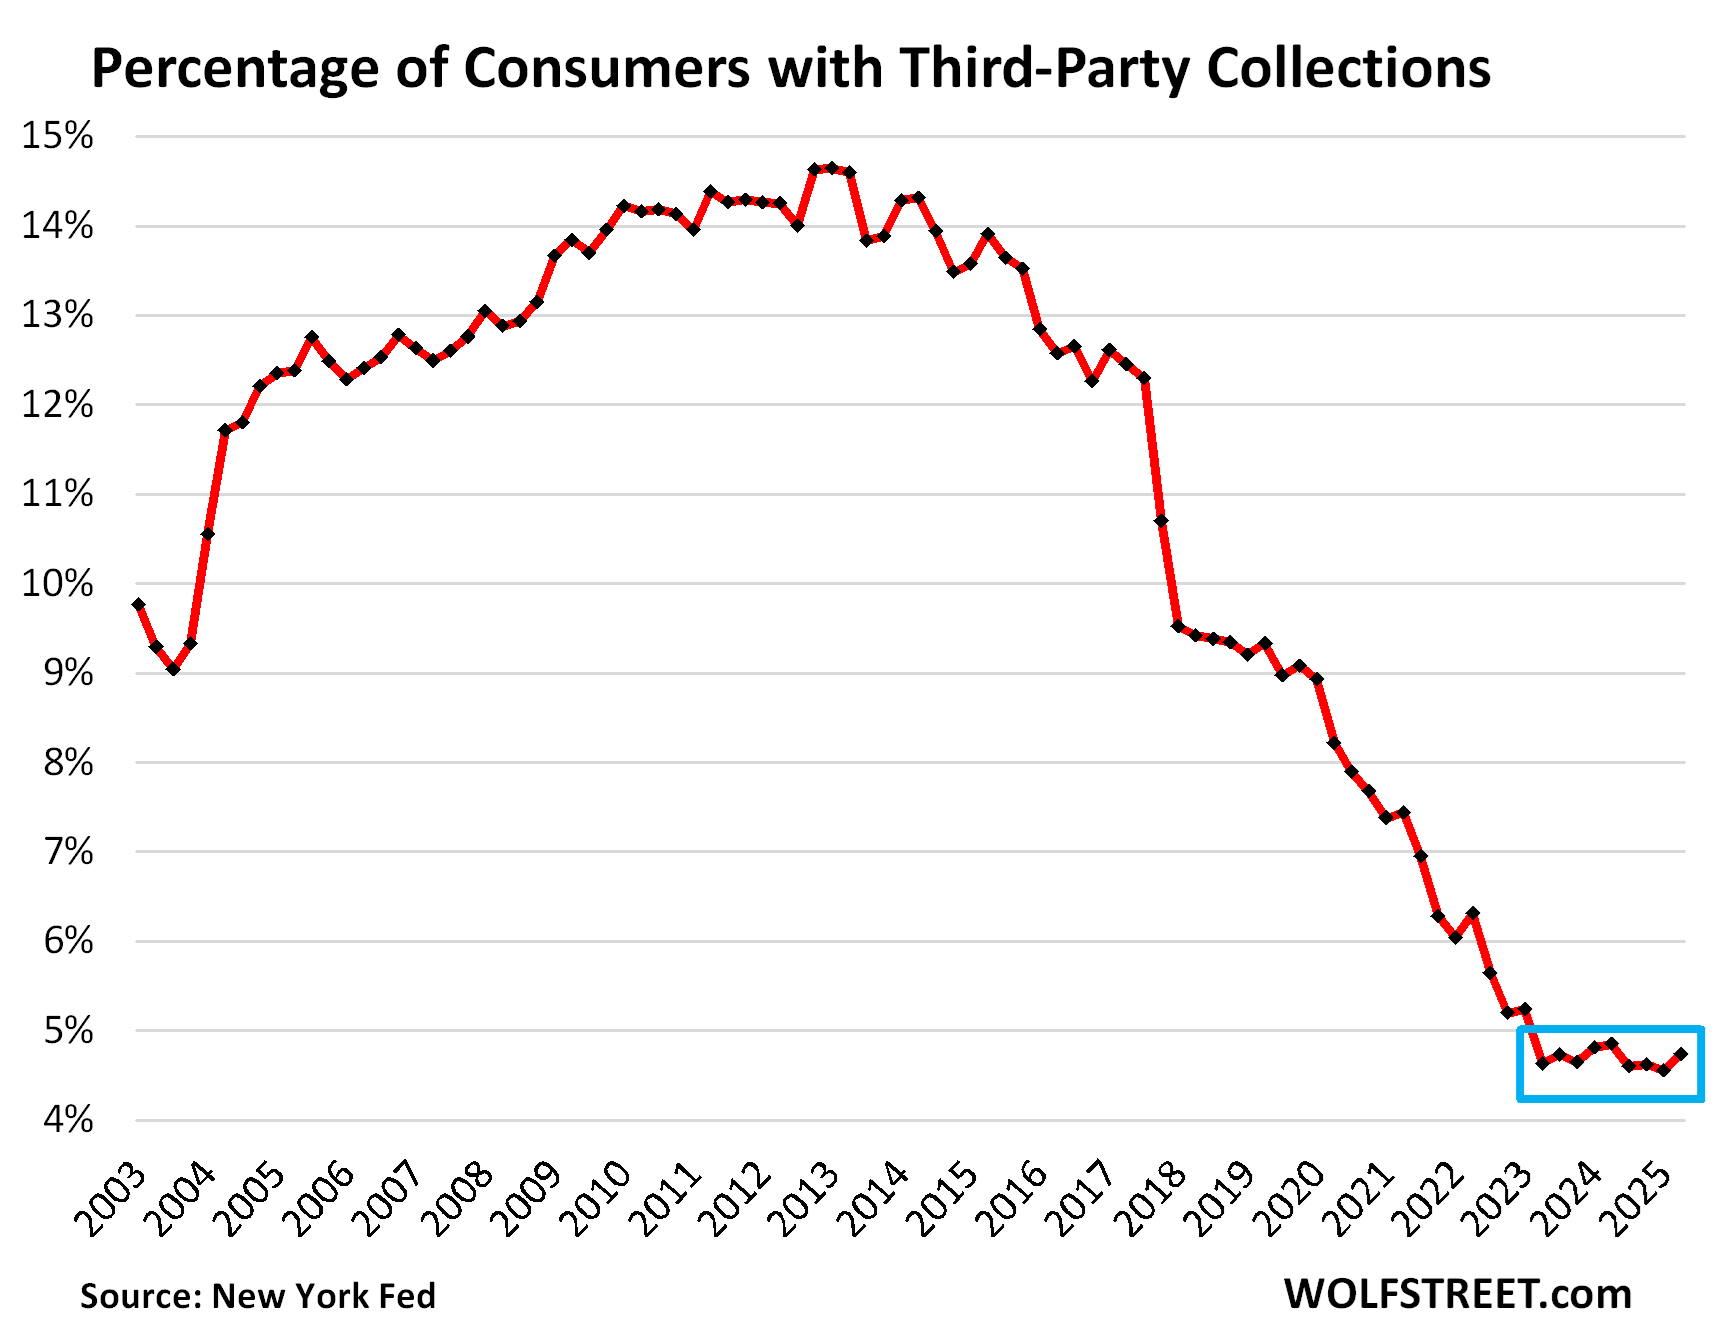
Third-party collections at rock bottom. A third-party collection entry is made into a consumer’s credit history when the lender reports to the credit bureaus, such as Equifax, that it sold the delinquent loan, such as credit card debt, to a collection agency for cents on the dollar. The New York Fed obtained this data on third-party collections in anonymized form through its partnership with Equifax.
The percentage of consumers with third-party collections skidded from record low to record low during the Free Money era and has hobbled along near those record lows even after the free money vanished, and in Q2 was 4.7%.
But, but, but… there is some discussion to turn defaulted federal student loans over to collection agencies – and if that ever happens, it will cause the percentage of consumers with collection entries in their credit records to spike.
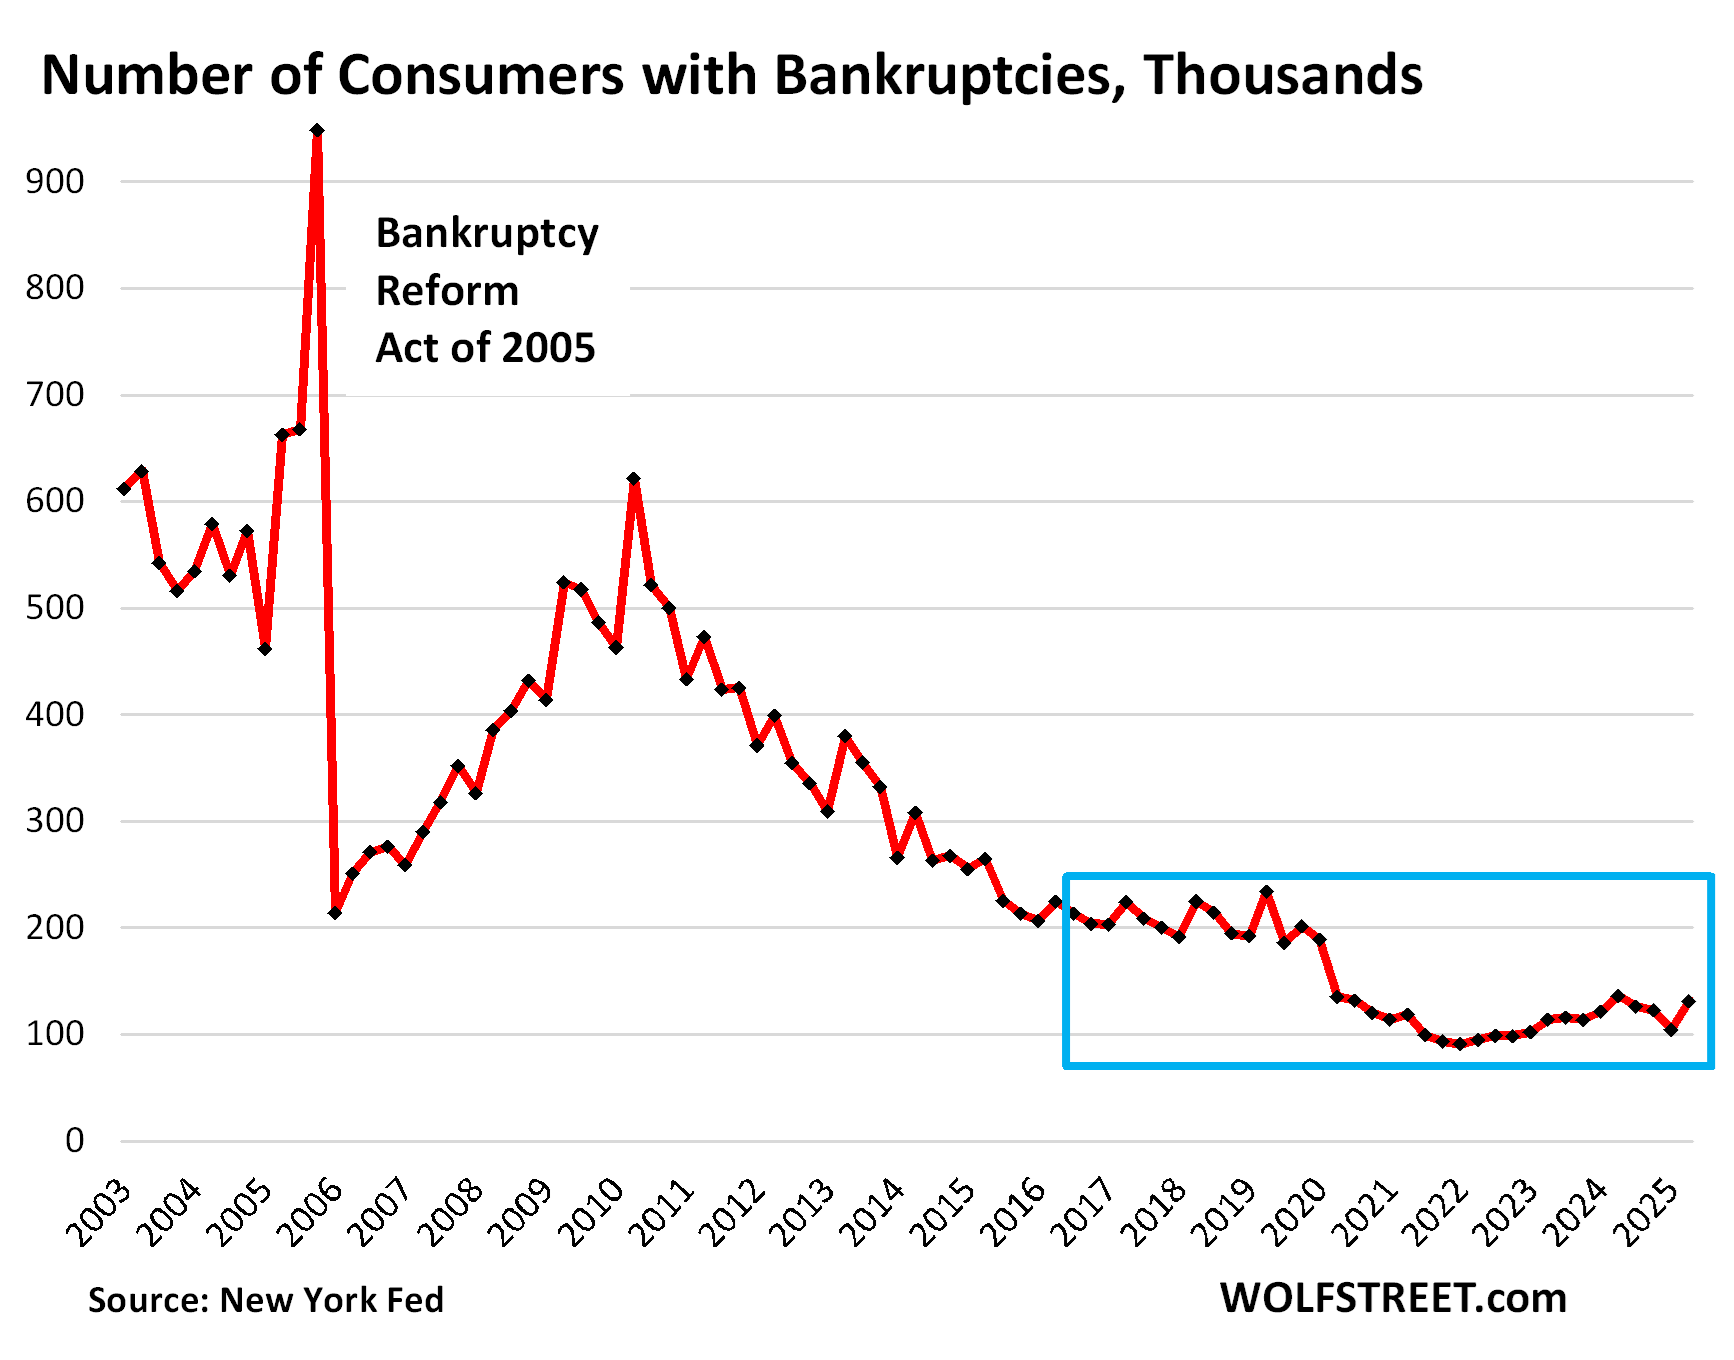
Bankruptcies remain low. The number of consumers with bankruptcy filings rose from a near-record low to 131,320 in Q2.
During the Good Times before the pandemic, the number of consumers with bankruptcy filings ranged from 186,000 to 234,000, which had also been historically low.
We’re going to wade into housing debt, credit card debt, and auto debt in separate articles over the next few days. Next one up is housing debt.
Upcoming Events
Defense and Compliance AttorneysSecure Complaint RMAI Certified Broker